OpenTelemetry ile Distributed Tracing - Mikroservis Sorun Tespiti
Mikroservis mimarisinde bir kullanıcı isteği birden fazla servisten geçer ve herhangi bir noktadaki gecikme veya hata, tüm zinciri etkiler. Geleneksel log analizi ile hangi servisin darboğaz yarattığını bulmak saatler sürebilir. OpenTelemetry ile distributed tracing kurarak her isteğin servisler ara
Can Kaya
Güvenlik Uzmanı
Mikroservis mimarisinde bir kullanıcı isteği birden fazla servisten geçer ve herhangi bir noktadaki gecikme veya hata, tüm zinciri etkiler. Geleneksel log analizi ile hangi servisin darboğaz yarattığını bulmak saatler sürebilir. OpenTelemetry ile distributed tracing kurarak her isteğin servisler arasındaki yolculuğunu trace ID ile uçtan uca izleyebilir, gecikme noktalarını milisaniye düzeyinde tespit edebilirsiniz. Bu rehberde OpenTelemetry mimarisinden SDK entegrasyonuna, Jaeger kurulumundan production best practice'lerine kadar tüm süreci ele alıyoruz.
Distributed Tracing Nedir ve Neden Gereklidir?
Distributed tracing, bir isteğin dağıtık sistemdeki tüm servisler boyunca izlenmesini sağlayan bir observability yöntemidir. Monolitik uygulamalarda tek bir stack trace sorunu gösterirken, mikroservislerde istek API Gateway'den başlayıp auth servisi, order servisi, payment servisi ve notification servisi gibi birçok bileşenden geçer.
Her servis kendi logunu üretir ancak bu loglar arasında korelasyon kurmak zordur. Distributed tracing bu sorunu trace ID ve span kavramlarıyla çözer:
| Kavram | Açıklama | Örnek |
|---|---|---|
| Trace | Bir isteğin uçtan uca yolculuğu | GET /api/orders/123 tüm servisler |
| Span | Trace içindeki tek bir operasyon birimi | order-service: DB sorgusu (45ms) |
| Trace ID | Tüm span'leri birleştiren benzersiz kimlik | 4bf92f3577b34da6a3ce929d0e0e4736 |
| Context Propagation | Trace bilgisinin servisler arası taşınması | traceparent HTTP header |
OpenTelemetry Mimarisi
OpenTelemetry (OTel), CNCF tarafından geliştirilen vendor-agnostic bir observability framework'üdür. Traces, metrics ve logs olmak üzere üç sinyal tipini destekler. Daha önce ayrı projeler olan OpenTracing ve OpenCensus, 2019'da OpenTelemetry altında birleştirilmiştir.
💡 Neden OpenTelemetry? Vendor lock-in olmadan Jaeger, Zipkin, Datadog, Grafana Tempo veya AWS X-Ray gibi herhangi bir backend'e veri gönderebilirsiniz. SDK'lar 11+ dilde mevcuttur ve auto-instrumentation ile kod değişikliği yapmadan tracing başlatabilirsiniz.
Temel Bileşenler
-
SDK (Software Development Kit) Uygulamanıza eklenen kütüphane. Span oluşturur, context propagation yapar ve telemetri verisini exporter'a iletir.
-
OTel Collector Telemetri verisini toplayan, işleyen ve backend'lere ileten bağımsız servis. Receiver, processor ve exporter pipeline'ından oluşur.
-
Backend (Jaeger, Tempo, Zipkin) Trace verilerini depolayan ve görselleştiren sistem. Jaeger açık kaynak ve production-ready bir seçenektir.
-
Auto-Instrumentation HTTP, gRPC, veritabanı ve mesaj kuyruğu çağrılarını otomatik olarak izleyen kütüphaneler. Kod değişikliği gerektirmez.
Jaeger + OTel Collector Docker Compose Kurulumu
Jaeger, Uber tarafından geliştirilen ve CNCF graduated projesi olan bir distributed tracing backend'idir. OTel Collector ile birlikte kullanarak uygulamalardan gelen trace verilerini toplar ve görselleştirir.
version: "3.8"
services:
  jaeger:
    image: jaegertracing/all-in-one:1.54
    ports:
      - "16686:16686"   # Jaeger UI
      - "4317:4317"     # OTLP gRPC
      - "4318:4318"     # OTLP HTTP
    environment:
      - COLLECTOR_OTLP_ENABLED=true
    networks:
      - tracing

  otel-collector:
    image: otel/opentelemetry-collector-contrib:0.96.0
    command: ["--config=/etc/otel-collector-config.yaml"]
    volumes:
      - ./otel-collector-config.yaml:/etc/otel-collector-config.yaml
    ports:
      - "4317:4317"     # OTLP gRPC receiver
      - "4318:4318"     # OTLP HTTP receiver
      - "8889:8889"     # Prometheus metrics
    depends_on:
      - jaeger
    networks:
      - tracing

networks:
  tracing:
    driver: bridge
OTel Collector yapılandırma dosyası receiver, processor ve exporter pipeline'ını tanımlar:
receivers:
  otlp:
    protocols:
      grpc:
        endpoint: 0.0.0.0:4317
      http:
        endpoint: 0.0.0.0:4318

processors:
  batch:
    timeout: 5s
    send_batch_size: 1024
  memory_limiter:
    check_interval: 1s
    limit_mib: 512
    spike_limit_mib: 128
  tail_sampling:
    decision_wait: 10s
    policies:
      - name: errors-policy
        type: status_code
        status_code: { status_codes: [ERROR] }
      - name: slow-traces
        type: latency
        latency: { threshold_ms: 2000 }
      - name: percentage-sample
        type: probabilistic
        probabilistic: { sampling_percentage: 10 }

exporters:
  otlp/jaeger:
    endpoint: jaeger:4317
    tls:
      insecure: true

service:
  pipelines:
    traces:
      receivers: [otlp]
      processors: [memory_limiter, tail_sampling, batch]
      exporters: [otlp/jaeger]
⚠️ Dikkat: Production ortamında tail_sampling processor kullanarak yalnızca hatalı, yavaş veya belirli bir yüzde trace'i saklayın. Tüm trace'leri saklamak depolama maliyetini hızla artırır. Yukarıdaki yapılandırma hatalı isteklerin tamamını, 2 saniyeden yavaş istekleri ve geri kalanın %10'unu saklar.
Node.js Uygulamasında OpenTelemetry Kurulumu
Node.js için OpenTelemetry SDK'sı auto-instrumentation desteği sunar. Express, Fastify, HTTP, gRPC, PostgreSQL, Redis ve daha birçok kütüphane otomatik olarak izlenir.
npm install @opentelemetry/sdk-node \
  @opentelemetry/auto-instrumentations-node \
  @opentelemetry/exporter-trace-otlp-grpc \
  @opentelemetry/resources \
  @opentelemetry/semantic-conventions
Tracing yapılandırmasını uygulamanızın en başında (diğer import'lardan önce) yükleyin:
import { NodeSDK } from '@opentelemetry/sdk-node';
import { getNodeAutoInstrumentations } from '@opentelemetry/auto-instrumentations-node';
import { OTLPTraceExporter } from '@opentelemetry/exporter-trace-otlp-grpc';
import { Resource } from '@opentelemetry/resources';
import { ATTR_SERVICE_NAME, ATTR_SERVICE_VERSION }
  from '@opentelemetry/semantic-conventions';

const sdk = new NodeSDK({
  resource: new Resource({
    [ATTR_SERVICE_NAME]: 'order-service',
    [ATTR_SERVICE_VERSION]: '1.2.0',
    'deployment.environment': process.env.NODE_ENV || 'development',
  }),
  traceExporter: new OTLPTraceExporter({
    url: process.env.OTEL_EXPORTER_OTLP_ENDPOINT || 'http://localhost:4317',
  }),
  instrumentations: [
    getNodeAutoInstrumentations({
      '@opentelemetry/instrumentation-fs': { enabled: false },
    }),
  ],
});

sdk.start();
console.log('OpenTelemetry tracing initialized');

process.on('SIGTERM', () => {
  sdk.shutdown().then(() => process.exit(0));
});
Uygulamayı başlatırken tracing dosyasını ilk olarak yükleyin:
# TypeScript
node --require ./tracing.js dist/main.js

# Veya environment variable ile
OTEL_EXPORTER_OTLP_ENDPOINT=http://otel-collector:4317 \
node --require ./tracing.js dist/main.js
Python Uygulamasında OpenTelemetry Kurulumu
Python SDK'sı Flask, Django, FastAPI, SQLAlchemy, Redis ve requests gibi popüler kütüphaneler için auto-instrumentation sağlar.
pip install opentelemetry-distro opentelemetry-exporter-otlp
opentelemetry-bootstrap -a install# Zero-code instrumentation ile başlatma
OTEL_SERVICE_NAME=payment-service \
OTEL_EXPORTER_OTLP_ENDPOINT=http://otel-collector:4317 \
opentelemetry-instrument python app.pyManuel Span Oluşturma ve Zenginleştirme
Auto-instrumentation HTTP ve veritabanı çağrılarını otomatik izler, ancak iş mantığı operasyonlarını (ödeme doğrulama, stok kontrolü, fiyat hesaplama) izlemek için manuel span oluşturmanız gerekir.
import { trace, SpanStatusCode } from '@opentelemetry/api';

const tracer = trace.getTracer('order-service');

async function processOrder(orderId: string) {
  return tracer.startActiveSpan('processOrder', async (span) => {
    try {
      // Span'e iş mantığı bilgisi ekle
      span.setAttribute('order.id', orderId);
      span.setAttribute('order.source', 'web');

      // Alt span: stok kontrolü
      const stock = await tracer.startActiveSpan(
        'checkInventory',
        async (childSpan) => {
          const result = await inventoryService.check(orderId);
          childSpan.setAttribute('inventory.available', result.available);
          childSpan.end();
          return result;
        }
      );

      // Alt span: odeme islemi
      await tracer.startActiveSpan(
        'processPayment',
        async (paymentSpan) => {
          paymentSpan.setAttribute('payment.method', 'credit_card');
          await paymentService.charge(orderId);
          paymentSpan.end();
        }
      );

      span.setStatus({ code: SpanStatusCode.OK });
    } catch (error) {
      span.setStatus({
        code: SpanStatusCode.ERROR,
        message: error.message,
      });
      span.recordException(error);
      throw error;
    } finally {
      span.end();
    }
  });
}
💡 Best Practice: Span attribute'larına hassas veri (kredi kartı numarası, şifre, kişisel bilgi) eklemeyin. Yalnızca sorun tespitine yardımcı olacak iş mantığı bilgilerini (order ID, kullanıcı tipi, ödeme yöntemi) ekleyin.
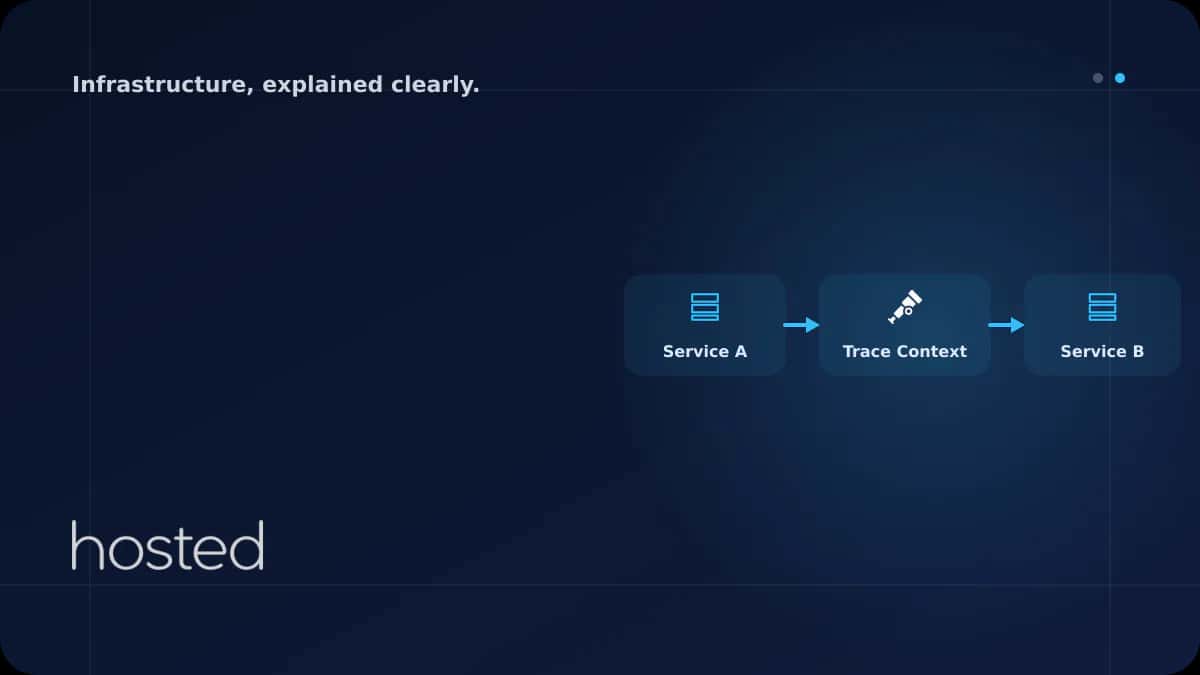
Context Propagation: Servisler Arası Trace Bağlantısı
Distributed tracing'in çalışması için trace context'in servisler arasında taşınması gerekir. W3C Trace Context standardı traceparent HTTP header'ı ile bunu sağlar.
# Format: version-traceId-parentSpanId-traceFlags
traceparent: 00-4bf92f3577b34da6a3ce929d0e0e4736-00f067aa0ba902b7-01

# 00          = version (W3C spec v1)
# 4bf92f...   = 128-bit trace ID
# 00f067...   = 64-bit parent span ID
# 01          = trace flags (01 = sampled)
OpenTelemetry SDK'ları HTTP isteklerinde bu header'ı otomatik olarak ekler ve okur. gRPC metadata, Kafka header ve AMQP properties üzerinden de propagation desteklenir. Farklı dillerdeki servisler arasında sorunsuz çalışır - Node.js servisi Python servisine istek attığında trace context otomatik taşınır.
Kubernetes Ortamında OTel Collector Dağıtımı
Kubernetes'te OTel Collector'ı DaemonSet veya Sidecar olarak dağıtabilirsiniz. DaemonSet yaklaşımı her node'da bir collector çalıştırır ve o node'daki tüm pod'lardan telemetri toplar.
| Dağıtım Modeli | Avantaj | Dezavantaj |
|---|---|---|
| DaemonSet | Kaynak verimli, merkezi yönetim | Node başına tek config |
| Sidecar | Servis bazlı özelleştirme | Daha fazla kaynak tüketimi |
| Gateway (Deployment) | Merkezi sampling ve routing | Tek hata noktası riski |
Önerilen production mimarisi: DaemonSet collector'lar node'lardan veri toplar, Gateway collector merkezi sampling ve routing yapar, ardından Jaeger veya Tempo'ya gönderir.
Production Best Practice'leri
Sampling Stratejisi
Yüksek trafikli sistemlerde tüm istekleri trace etmek hem performans hem depolama açısından sürdürülebilir değildir. Doğru sampling stratejisi kritiktir:
-
Head-based Sampling İstek başlangıcında karar verilir. Basit ve düşük overhead, ancak hatalı istekleri kaçırabilir. Geliştirme ortamı için uygundur.
-
Tail-based Sampling (Önerilen) Trace tamamlandıktan sonra karar verilir. Hatalı ve yavaş isteklerin %100'ü saklanır, başarılı isteklerin belirli bir yüzdesi alınır. OTel Collector'da yapılandırılır.
-
Rate Limiting Saniyede maksimum trace sayısını sınırlayın. Ani trafik artışlarında collector'ın bellek tüketimini kontrol altında tutar.
Performans Etkisini Minimize Etme
OpenTelemetry SDK'sının uygulama performansına etkisi genellikle %1-3 arasındadır, ancak yanlış yapılandırma bu oranı artırabilir. Dikkat edilmesi gerekenler:
Batch exporter kullanın (varsayılan). Span'leri tek tek göndermek yerine toplu gönderim yapın. fs instrumentation'ını devre dışı bırakın - dosya sistemi operasyonları çok fazla span üretir ve genellikle gereksizdir. Attribute sayısını makul tutun; span başına 10-15 attribute yeterlidir. Büyük string değerlerini (request body, SQL sorgusu) attribute olarak eklemeyin.
Merkezi log yönetimi için ELK Stack rehberimizi, sunucu metrikleri için Prometheus + Grafana rehberimizi, container orkestrasyon için Kubernetes'e Giriş rehberimizi inceleyin. OpenTelemetry Resmi Dokümantasyonu ve Jaeger Dokümantasyonu ek kaynak olarak faydalıdır.
Sıkça Sorulan Sorular
OpenTelemetry ile Jaeger arasındaki fark nedir?
OpenTelemetry telemetri verisi toplama ve gönderme framework'üdür (SDK + Collector). Jaeger ise bu veriyi depolayan ve görselleştiren bir backend'dir. OTel veriyi üretir, Jaeger tüketir. Jaeger yerine Grafana Tempo, Zipkin veya Datadog da kullanabilirsiniz.
Distributed tracing uygulama performansını ne kadar etkiler?
Doğru yapılandırılmış OpenTelemetry SDK'sı genellikle %1-3 overhead ekler. Batch exporter, uygun sampling oranı ve gereksiz instrumentation'ların kapatılması ile bu etki minimize edilir. Kritik yollarda head-based sampling ile overhead daha da düşürülebilir.
Monolitik uygulamada distributed tracing gerekli mi?
Tek bir monolitik uygulamada distributed tracing'in faydası sınırlıdır. Ancak monolitiniz veritabanı, cache (Redis) ve harici API'ler ile iletişim kuruyorsa, bu çağrıların süresini ve hatalarını izlemek için tracing faydalı olabilir. Mikroservise geçiş planınız varsa erken entegrasyon avantaj sağlar.
Trace verilerini ne kadar süre saklamalıyım?
Genellikle 7-14 gün yeterlidir. Hatalı trace'leri daha uzun (30 gün) saklayabilirsiniz. Jaeger'da retention policy ile otomatik silme yapılandırın. Uyumluluk gereksinimleri varsa (PCI-DSS, SOC 2) ilgili standarda göre süreyi belirleyin.
Sonuç
OpenTelemetry ile distributed tracing kurarak mikroservis mimarinizde gecikme noktalarını ve hataları uçtan uca tespit edin. OTel Collector ile vendor-agnostic bir telemetri pipeline'ı oluşturun, tail-based sampling ile depolama maliyetini kontrol altında tutun ve Jaeger UI üzerinden trace'leri görselleştirin.
Mikroservisleriniz İçin Yüksek Performanslı Altyapı
Hosted Cloud sunucuları ile distributed tracing altyapınızı güvenle çalıştırın.
Bulut Sunucu Planlarını İncele →Can Kaya
Güvenlik Uzmanı
Siber güvenlik, DDoS koruması ve sunucu sertleştirme konularında içerikler üretmektedir. CISSP sertifikalı güvenlik uzmanı.
Yorumlar yakında