Centralized Log Management with ELK Stack
Checking logs from multiple servers and applications one by one via SSH is inefficient and error-prone. With ELK Stack (Elasticsearch, Logstash, Kibana), you can collect, search, and visualize all your logs in a centralized location. This guide covers ELK architecture, Docker Compose setup, Logstash
Elif Demir
Cloud Solutions Architect
Checking logs from multiple servers and applications one by one via SSH is inefficient and error-prone. With ELK Stack (Elasticsearch, Logstash, Kibana), you can collect, search, and visualize all your logs in a centralized location. This guide covers ELK architecture, Docker Compose setup, Logstash pipeline configuration, and Kibana dashboard creation.
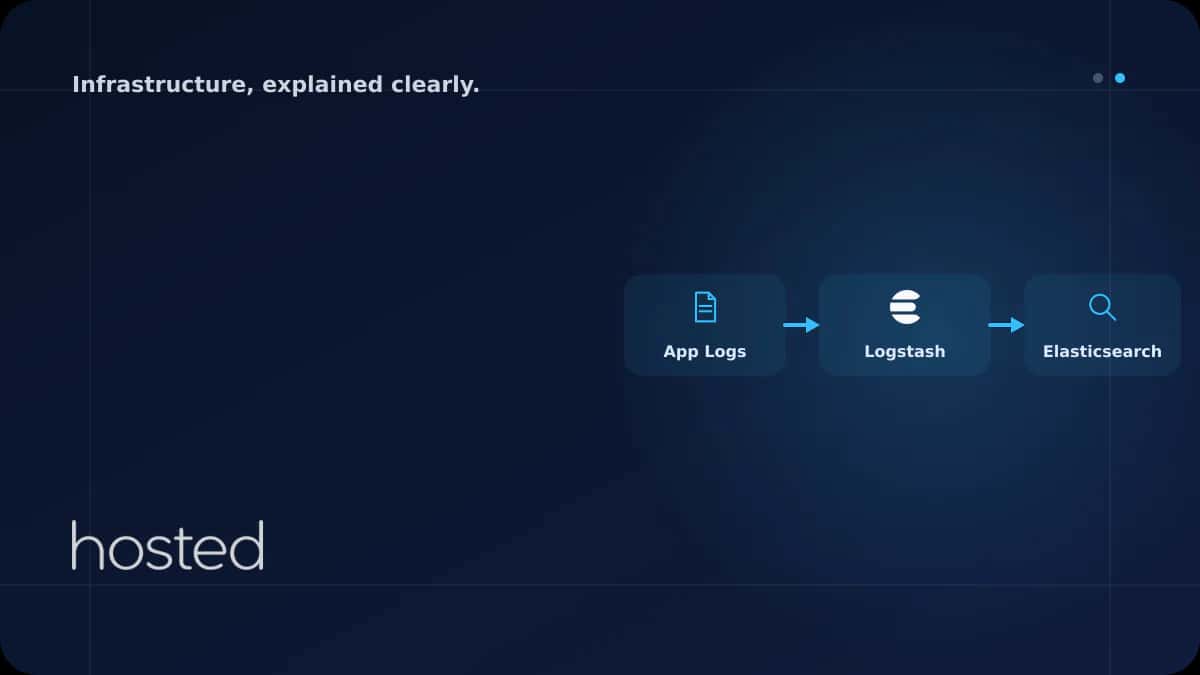
ELK Stack Architecture
ELK Stack consists of three core components. Filebeat is added as a lightweight shipper that reads log files and sends them to Logstash or directly to Elasticsearch.
| Component | Role | Port |
|---|---|---|
| Elasticsearch | Log storage, indexing, and search engine | 9200 / 9300 |
| Logstash | Log collection, transformation, and routing | 5044 / 5000 |
| Kibana | Log visualization and dashboards | 5601 |
| Filebeat | Lightweight log shipper (installed on servers) | - |
ELK Setup with Docker Compose
You can quickly spin up the ELK Stack with Docker Compose. The following configuration starts Elasticsearch, Logstash, and Kibana with a single command.
version: "3.8"
services:
  elasticsearch:
    image: docker.elastic.co/elasticsearch/elasticsearch:8.12.0
    environment:
      - discovery.type=single-node
      - xpack.security.enabled=false
      - "ES_JAVA_OPTS=-Xms1g -Xmx1g"
    ports:
      - "9200:9200"
    volumes:
      - es_data:/usr/share/elasticsearch/data
    networks:
      - elk

  logstash:
    image: docker.elastic.co/logstash/logstash:8.12.0
    ports:
      - "5044:5044"
      - "5000:5000"
    volumes:
      - ./logstash/pipeline:/usr/share/logstash/pipeline
    depends_on:
      - elasticsearch
    networks:
      - elk

  kibana:
    image: docker.elastic.co/kibana/kibana:8.12.0
    ports:
      - "5601:5601"
    environment:
      - ELASTICSEARCH_HOSTS=http://elasticsearch:9200
    depends_on:
      - elasticsearch
    networks:
      - elk

volumes:
  es_data:

networks:
  elk:
    driver: bridge
⚠️ Warning: Elasticsearch consumes significant memory. Allocate at least 4 GB RAM in production. Set the JVM heap size to half of total RAM with ES_JAVA_OPTS, but do not exceed 32 GB.
Logstash Pipeline Configuration
A Logstash pipeline consists of three stages: input (data source), filter (transformation), and output (destination). The following configuration parses logs from Filebeat and writes them to Elasticsearch.
input {
  beats {
    port => 5044
  }
  tcp {
    port => 5000
    codec => json
  }
}

filter {
  # Parse Nginx access logs
  if [fields][log_type] == "nginx-access" {
    grok {
      match => {
        "message" => "%{IPORHOST:client_ip} - %{DATA:user} \[%{HTTPDATE:timestamp}\] \"%{WORD:method} %{DATA:request} HTTP/%{NUMBER:http_version}\" %{NUMBER:response_code} %{NUMBER:bytes}"
      }
    }
    date {
      match => ["timestamp", "dd/MMM/yyyy:HH:mm:ss Z"]
    }
    geoip {
      source => "client_ip"
    }
  }

  # Remove unnecessary fields
  mutate {
    remove_field => ["host", "@version"]
  }
}

output {
  elasticsearch {
    hosts => ["http://elasticsearch:9200"]
    index => "logs-%{[fields][log_type]}-%{+YYYY.MM.dd}"
  }
}
Log Shipping with Filebeat
Filebeat is a lightweight agent that reads log files on servers and sends them to Logstash or directly to Elasticsearch. It should be installed on every application server.
filebeat.inputs:
  - type: filestream
    id: nginx-access
    paths:
      - /var/log/nginx/access.log
    fields:
      log_type: nginx-access

  - type: filestream
    id: app-logs
    paths:
      - /var/log/app/*.log
    fields:
      log_type: application
    parsers:
      - ndjson:
          target: ""

output.logstash:
  hosts: ["logstash-server:5044"]

processors:
  - add_host_metadata: ~
  - add_cloud_metadata: ~
Index Lifecycle Management (ILM)
Logs grow continuously and consume disk space. With Elasticsearch's ILM feature, you can automatically manage the lifecycle of indices: hot, warm, cold, and delete phases.
PUT _ilm/policy/logs-policy
{
  "policy": {
    "phases": {
      "hot": {
        "actions": {
          "rollover": {
            "max_size": "50gb",
            "max_age": "1d"
          }
        }
      },
      "warm": {
        "min_age": "7d",
        "actions": {
          "shrink": { "number_of_shards": 1 },
          "forcemerge": { "max_num_segments": 1 }
        }
      },
      "delete": {
        "min_age": "30d",
        "actions": {
          "delete": {}
        }
      }
    }
  }
}
💡 Tip: Use ILM to move logs older than 7 days to warm nodes to reduce SSD costs. Automatically delete logs older than 30 days or archive them to cold storage. Adjust retention periods according to compliance requirements.
For server monitoring, check our Prometheus + Grafana guide. For server security, see our Server Hardening Checklist guide. For container environments, explore our Docker Multi-Stage Build guide. Elasticsearch Official Documentation and Logstash Documentation are valuable additional resources.
Frequently Asked Questions
What are the minimum server requirements for ELK Stack?
For development, 4 GB RAM and 2 vCPUs are sufficient. In production, at least 8 GB RAM, 4 vCPUs, and SSD storage are recommended for Elasticsearch. For high log volumes, set up an Elasticsearch cluster (3+ nodes).
Can I use Filebeat directly instead of Logstash?
Yes, Filebeat can send logs directly to Elasticsearch. However, if you need complex log transformations (grok, geoip, mutate), you need Logstash. For simple JSON logs, Filebeat + Elasticsearch is sufficient.
What are the alternatives to ELK Stack?
Loki + Grafana (lighter, label-based), Graylog (easy setup), Fluentd/Fluent Bit (CNCF project), and OpenSearch (Elasticsearch fork) are popular alternatives. Loki is especially preferred in Kubernetes environments.
How do I secure Elasticsearch?
Do not expose Elasticsearch to the public network - allow access only from the internal network. Enable authentication and TLS encryption with X-Pack Security. Protect Kibana access behind a reverse proxy with HTTPS.
Conclusion
Set up centralized log management with ELK Stack to monitor all your server and application logs from a single point. Configure log collection with Filebeat, transformation with Logstash, storage with Elasticsearch, and visualization with Kibana. Optimize disk usage with ILM policies.
High-Performance Servers for ELK Stack
Run your centralized logging infrastructure with confidence on Hosted Cloud servers.
Explore Cloud Server Plans →Elif Demir
Cloud Solutions Architect
Specializing in enterprise cloud migration projects and hybrid infrastructure design with 8 years of experience in AWS, Azure, and private cloud environments.
Comments coming soon