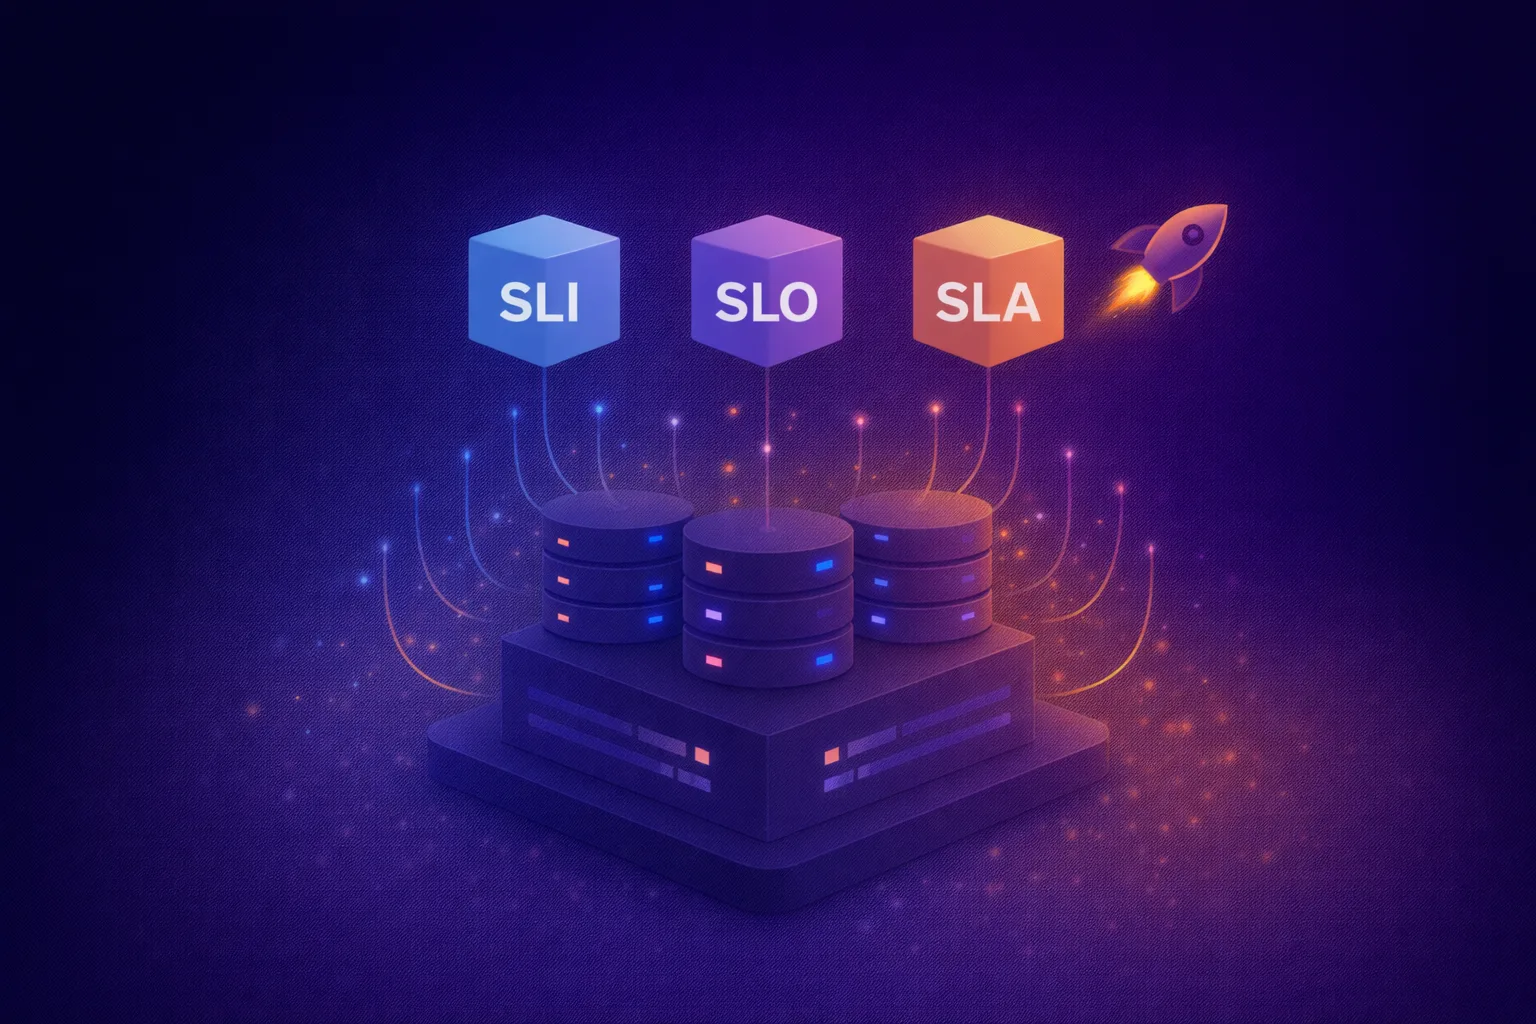
What Are SLI, SLO and SLA? A Guide to Service Reliability Metrics
Saying a service is "reliable" is not enough - you need to define it with measurable metrics. SLI (Service Level Indicator), SLO (Service Level Objective), and SLA (Service Level Agreement) are the building blocks of this measurement. Born from Google's Site Reliability Engineering (SRE) approach, t
Merve Arslan
WordPress & Hosting Expert
Saying a service is "reliable" is not enough - you need to define it with measurable metrics. SLI (Service Level Indicator), SLO (Service Level Objective), and SLA (Service Level Agreement) are the building blocks of this measurement. Born from Google's Site Reliability Engineering (SRE) approach, these concepts define service quality numerically and enable teams to make informed decisions. This guide explains each concept with concrete examples, demonstrates error budget calculation, and walks through setting up SLI measurement with Prometheus step by step.
SLI, SLO, and SLA: Core Concepts
These three concepts are related but operate at different layers. SLI measures, SLO sets targets, SLA commits.
| Concept | Definition | Who Defines It? | Example |
|---|---|---|---|
| SLI | Measurable indicator of service quality | Engineering team | Successful request ratio: 99.95% |
| SLO | Target value set for an SLI | Engineering + Product team | Success rate >= 99.9% (30 days) |
| SLA | Legal commitment with the customer | Business + Legal team | 99.9% uptime, 10% credit on breach |
💡 Critical Rule: The SLA should always be more relaxed than the SLO. If your SLO is 99.95%, set the SLA at 99.9%. This gap creates a buffer zone for you to intervene before an SLA breach. Think of the SLO as an internal target and the SLA as an external commitment.
Defining SLIs: Choosing the Right Metrics
SLI selection varies based on your service type. The Google SRE book defines four fundamental SLI categories:
-
Availability The ratio of successful responses to total requests. Formula: successful requests / total requests. The most fundamental SLI for web APIs and websites.
-
Latency Request response time. Typically measured as p50, p95, and p99 percentiles. Directly impacts user experience.
-
Throughput Number of requests processed per unit time. Critical SLI for data pipelines and batch processing systems.
-
Correctness The ratio of correct responses. Critical for payment systems and data processing services. Requests returning incorrect results count as failures.
SLI Recommendations by Service Type
| Service Type | Primary SLI | Secondary SLI |
|---|---|---|
| Web API | Availability (non-5xx / total) | Latency p99 < 500ms |
| E-commerce Site | Availability + Latency p95 | Checkout success rate |
| Data Pipeline | Freshness (data recency) | Correctness + Throughput |
| Storage Service | Durability (data loss rate) | Availability + Latency |
Error Budget: Balancing Reliability and Velocity
The error budget is the amount of failure your SLO permits. A service with a 99.9% SLO target has a total of 43 minutes and 50 seconds of "failure allowance" in 30 days. When this budget is exhausted, new feature deployments are halted and the focus shifts to reliability improvements.
# SLO: 99.9% availability (30-day window)
Error Budget = 1 - SLO = 1 - 0.999 = 0.001 (0.1%)

# Time-based calculation
30 days = 30 x 24 x 60 = 43,200 minutes
Error Budget = 43,200 x 0.001 = 43.2 minutes

# Request-based calculation (1M requests/day)
30-day total = 30,000,000 requests
Error Budget = 30,000,000 x 0.001 = 30,000 failed requests

# Remaining budget
Consumed = actual_errors / total_requests
Remaining Budget = Error Budget - Consumed
⚠️ Error Budget Policy: When the error budget drops below 75%, halt risky deployments. Below 50%, deploy only reliability improvements. At 0%, freeze all feature deployments and conduct a postmortem. Establish this policy in writing with your team beforehand.
Measuring SLIs with Prometheus
You can use your application's HTTP metrics to measure SLIs in Prometheus. The following PromQL queries demonstrate basic SLI calculations.
Availability SLI
# Successful request ratio over the last 30 days
sum(rate(http_requests_total{code!~"5.."}[30d]))
/
sum(rate(http_requests_total[30d]))

# Remaining error budget percentage
1 - (
  (1 - (
    sum(rate(http_requests_total{code!~"5.."}[30d]))
    /
    sum(rate(http_requests_total[30d]))
  ))
  /
  (1 - 0.999)  # SLO target: 99.9%
)
Latency SLI
# p99 latency (using histogram)
histogram_quantile(0.99,
  sum(rate(http_request_duration_seconds_bucket[5m])) by (le)
)

# Ratio of requests responding under 500ms (latency SLI)
sum(rate(http_request_duration_seconds_bucket{le="0.5"}[30d]))
/
sum(rate(http_request_duration_seconds_count[30d]))
SLO Burn Rate Alerts
Use burn rate alerts instead of traditional threshold-based alerts. Burn rate measures how quickly the error budget is being consumed. This approach reduces false alarm rates and enables faster response to real issues.
groups:
  - name: slo-burn-rate
    rules:
      # Fast burn: 2% budget consumed in 1 hour (14.4x burn rate)
      - alert: SLOBurnRateCritical
        expr: |
          (
            sum(rate(http_requests_total{code=~"5.."}[1h]))
            /
            sum(rate(http_requests_total[1h]))
          ) > (14.4 * 0.001)
        for: 2m
        labels:
          severity: critical
        annotations:
          summary: "SLO burn rate critical - budget depleting rapidly"

      # Slow burn: 5% budget consumed in 6 hours (6x burn rate)
      - alert: SLOBurnRateWarning
        expr: |
          (
            sum(rate(http_requests_total{code=~"5.."}[6h]))
            /
            sum(rate(http_requests_total[6h]))
          ) > (6 * 0.001)
        for: 15m
        labels:
          severity: warning
        annotations:
          summary: "SLO burn rate elevated - budget depleting faster than expected"
SLA Management: Commitments and Consequences
An SLA is a legal contract with the customer, and breaches have financial consequences. Key considerations when defining SLAs:
Measurement Window
Clearly define whether you measure the SLA monthly or annually. Monthly windows provide tighter control.
Compensation Structure
Define credit percentages or penalty amounts in tiers for breach scenarios. Typically 10%-30% credits are applied.
Exclusions
Exclude planned maintenance, force majeure, and customer-caused issues from SLA scope. State these clearly in the contract.
For uptime monitoring setup, check our Alertmanager Downtime Notification guide. For server metrics, see our Prometheus + Grafana guide. For distributed tracing, review our OpenTelemetry guide. The Google SRE Book - SLO Chapter and Prometheus Alerting Best Practices are useful additional resources.
Frequently Asked Questions
Can I set my SLO to 100%?
No, a 100% SLO is practically impossible and not recommended. Zero error budget means you cannot make any changes. Every deployment and configuration change is a potential source of failure. Even 99.99% is a very aggressive target requiring significant infrastructure investment.
What should I do when the error budget is exhausted?
Halt feature deployments and focus on reliability improvements. Conduct postmortems to identify root causes. Strengthen automated tests, implement canary deployments, and expand monitoring coverage. Resume deployments when the budget renews (new measurement window).
What is the difference between SLO and SLA?
SLO is an internal target, SLA is an external commitment. SLO is a performance target set by the engineering team with no direct financial consequences for breaches. SLA is a legal contract with the customer where breaches result in compensation or credits. The SLA should always be more relaxed than the SLO.
How many SLIs should I define?
2-4 SLIs per service is sufficient. Defining too many SLIs complicates monitoring and decision-making. Focus on the metrics that most impact user experience. Typically, an availability + latency combination is a good starting point.
Conclusion
Measure service quality with SLIs, set targets with SLOs, and make commitments to your customers with SLAs. Balance reliability and development velocity with the error budget mechanism. Collect SLI metrics with Prometheus and detect SLO breaches early with burn rate alerts.
Server Infrastructure with High SLA Guarantees
Meet your SLA targets with Hosted Cloud's 99.9% uptime guaranteed servers.
Explore Cloud Server Plans →Merve Arslan
WordPress & Hosting Expert
Creating guide content on WordPress performance optimization, hosting selection, and e-commerce infrastructure.
Comments coming soon